# Metrics Service

The Metrics service provides:
- An additional REST endpoint to retrieve openHAB core metrics from. This can be used as a scrape target for pull-based monitoring systems like Prometheus (opens new window).
- Optionally configurable services to export openHAB core metrics to push-based monitoring systems like InfluxDB (opens new window).
# Provided Metrics
Currently, the following metrics are provided:
- openHAB event counts (per topic)
- openHAB bundle states
- openHAB thing states
- openHAB rule runs (per rule)
- openHAB thread pool stats (per scheduler)
- JVM stats including metrics of:
- Class loader
- Memory
- Garbage collector
- OS (system load, CPU)
- Thread metrics
# Configuration
The configuration for the Metrics service is available in the openHAB UI under Settings | Other Services | Metrics service. Support for pull-based monitoring systems (e.g., Prometheus) is always enabled since it doesn't imply any significant overhead when not used. Support for push-based monitoring systems (e.g., InfluxDB) has to be enabled separately.
The following configuration parameters can be set:
| Config param | Description | Default value |
|---|---|---|
| influxMetricsEnabled | Enable the Influx (<www.influxdata.com (opens new window)>) metrics. Further configuration of the InfluxDB instance is necessary. | false |
| jmxMetricsEnabled | Enable the Java Management Extensions (JMX) metrics. | false |
Refer to the corresponding monitoring system sections for monitoring system specific configuration parameters.
# Supported Monitoring Systems
For a start, the following formats are supported:
# Prometheus
Once the IO add-on is installed, the Prometheus endpoint will be available under: <openhab_host>:8080/rest/metrics/prometheus
Refer to the Prometheus (opens new window) documentation on how to set up a Prometheus instance and add a scrape configuration. A typical scrape config could look like this (excerpt from /etc/prometheus/prometheus.yml):
scrape_configs:
  - job_name: 'openhab'
    scrape_interval: 1m
    scheme: http
    metrics_path: /rest/metrics/prometheus
    static_configs:
    - targets:
      - 'openhab.local:8080'
Replace openhab.local by the openHAB host.
# Available Configuration Parameters
There are no Prometheus-specific configuration parameters.
# InfluxDB
The InfluxDB exporter service will start as soon as the influxMetricsEnabled configuration parameter is set to true.
# Available Configuration Parameters
| Config param | Description | Default value |
|---|---|---|
| influxURL | The URL of the InfluxDB instance. Defaults to http://localhost:8086 (opens new window). | http://localhost:8086 |
| influxDB | The name of the database to use. Defaults to "openhab". | openHAB |
| influxUsername | InfluxDB user name. | n/a |
| influxPassword | The InfluxDB password (no default). | n/a |
| influxUpdateIntervalInSeconds | Controls how often metrics are exported to InfluxDB (in seconds). Defaults to 300. | 300 |
# JMX
The Java Management Extensions (JMX) exporter service will start as soon as the jmxMetricsEnabled configuration parameter is set to true.
You can monitor the JMX metrics using a tool like JConsole (opens new window) or VisualVM (opens new window) (after installing the VisualVM-MBeans plugin).
When the JMX exporter is enabled, the metrics will be available under the "metrics" MBean.
JConsole and VisualVM will only be able to connect using JMX when openHAB is started in debug mode (use start_debug.sh or start_debug.bat).
# Configuration File Example
The example below shows how to configure the Metrics service using a file.
metrics.cfg:
influxMetricsEnabled=true
influxURL=https://influxdb
influxDB=metrics
influxUsername=openhab
influxPassword=77QjHkoWZEdbvXe9FWsJ
influxUpdateIntervalInSeconds=60

jmxMetricsEnabled=false
# Additional Metric Formats
The Metrics service was implemented using Micrometer (opens new window), which supports a number of monitoring systems (opens new window). It should be possible to add any of these, especially the ones using a pull mechanism ("scraping") like Prometheus does.
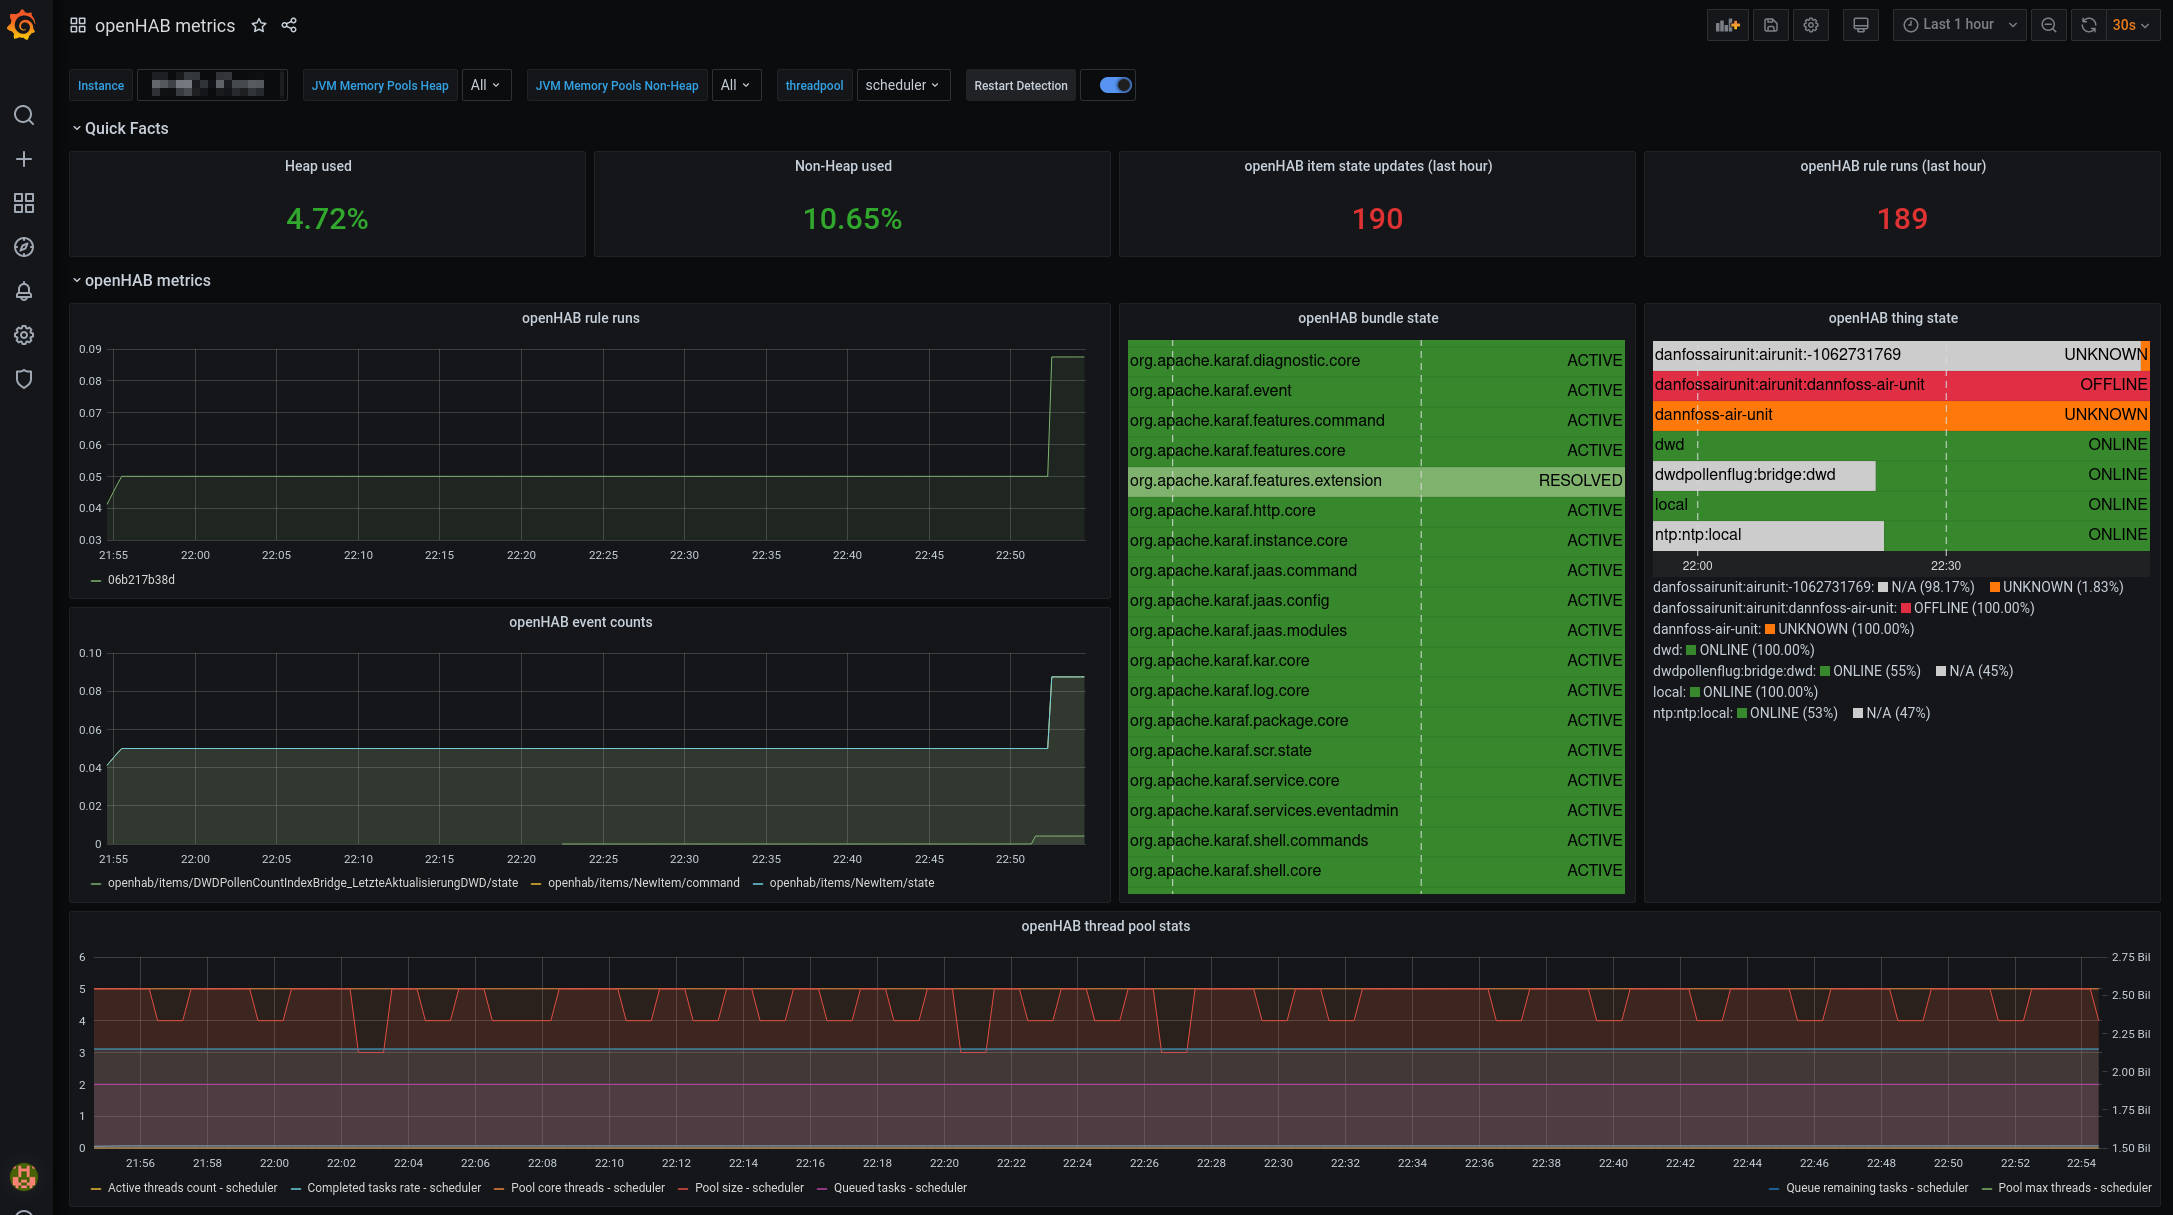
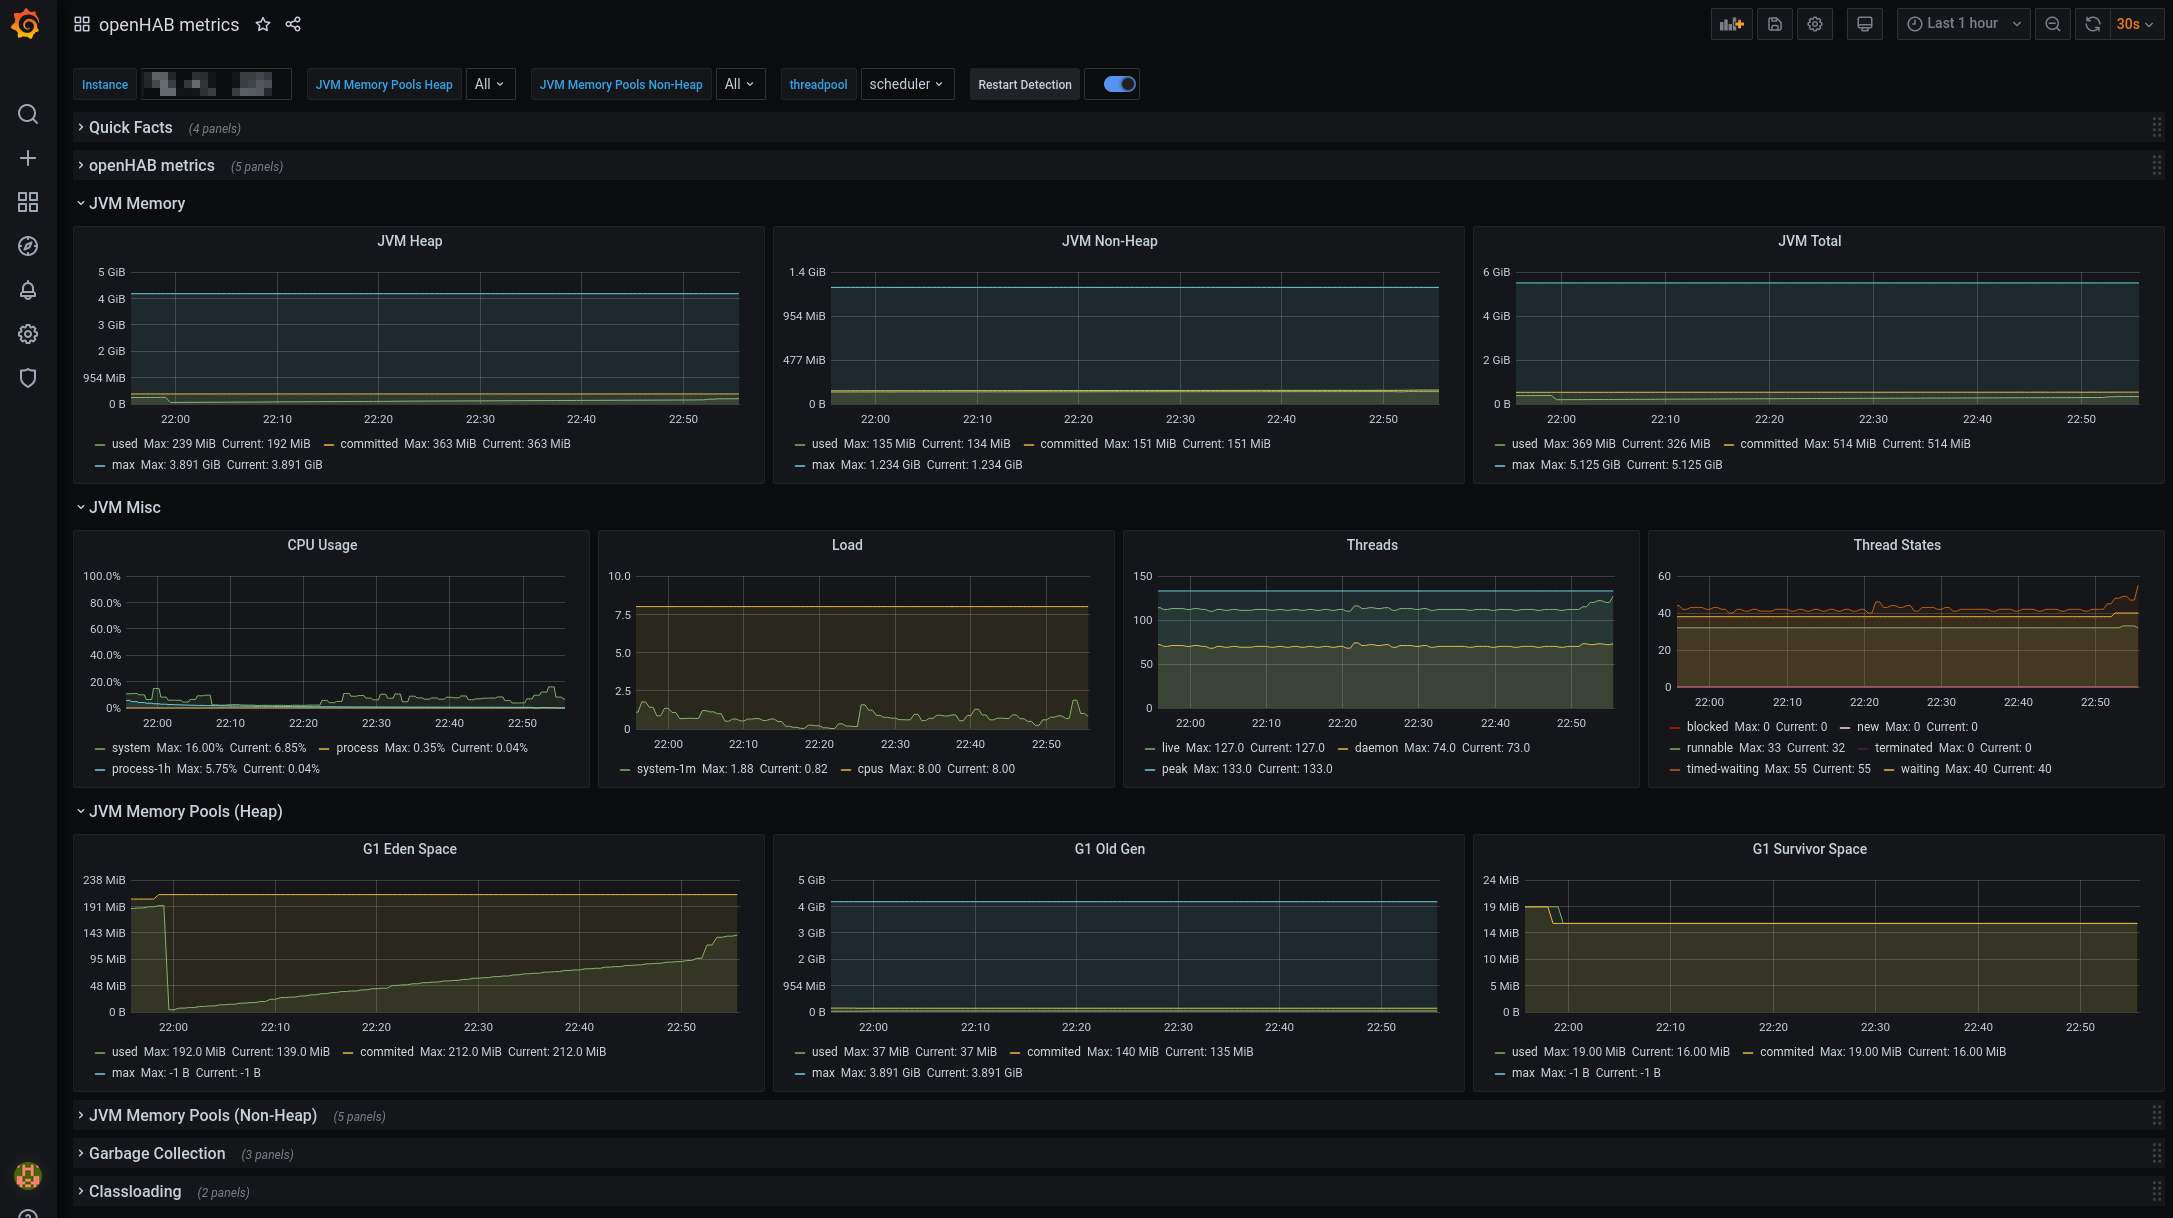
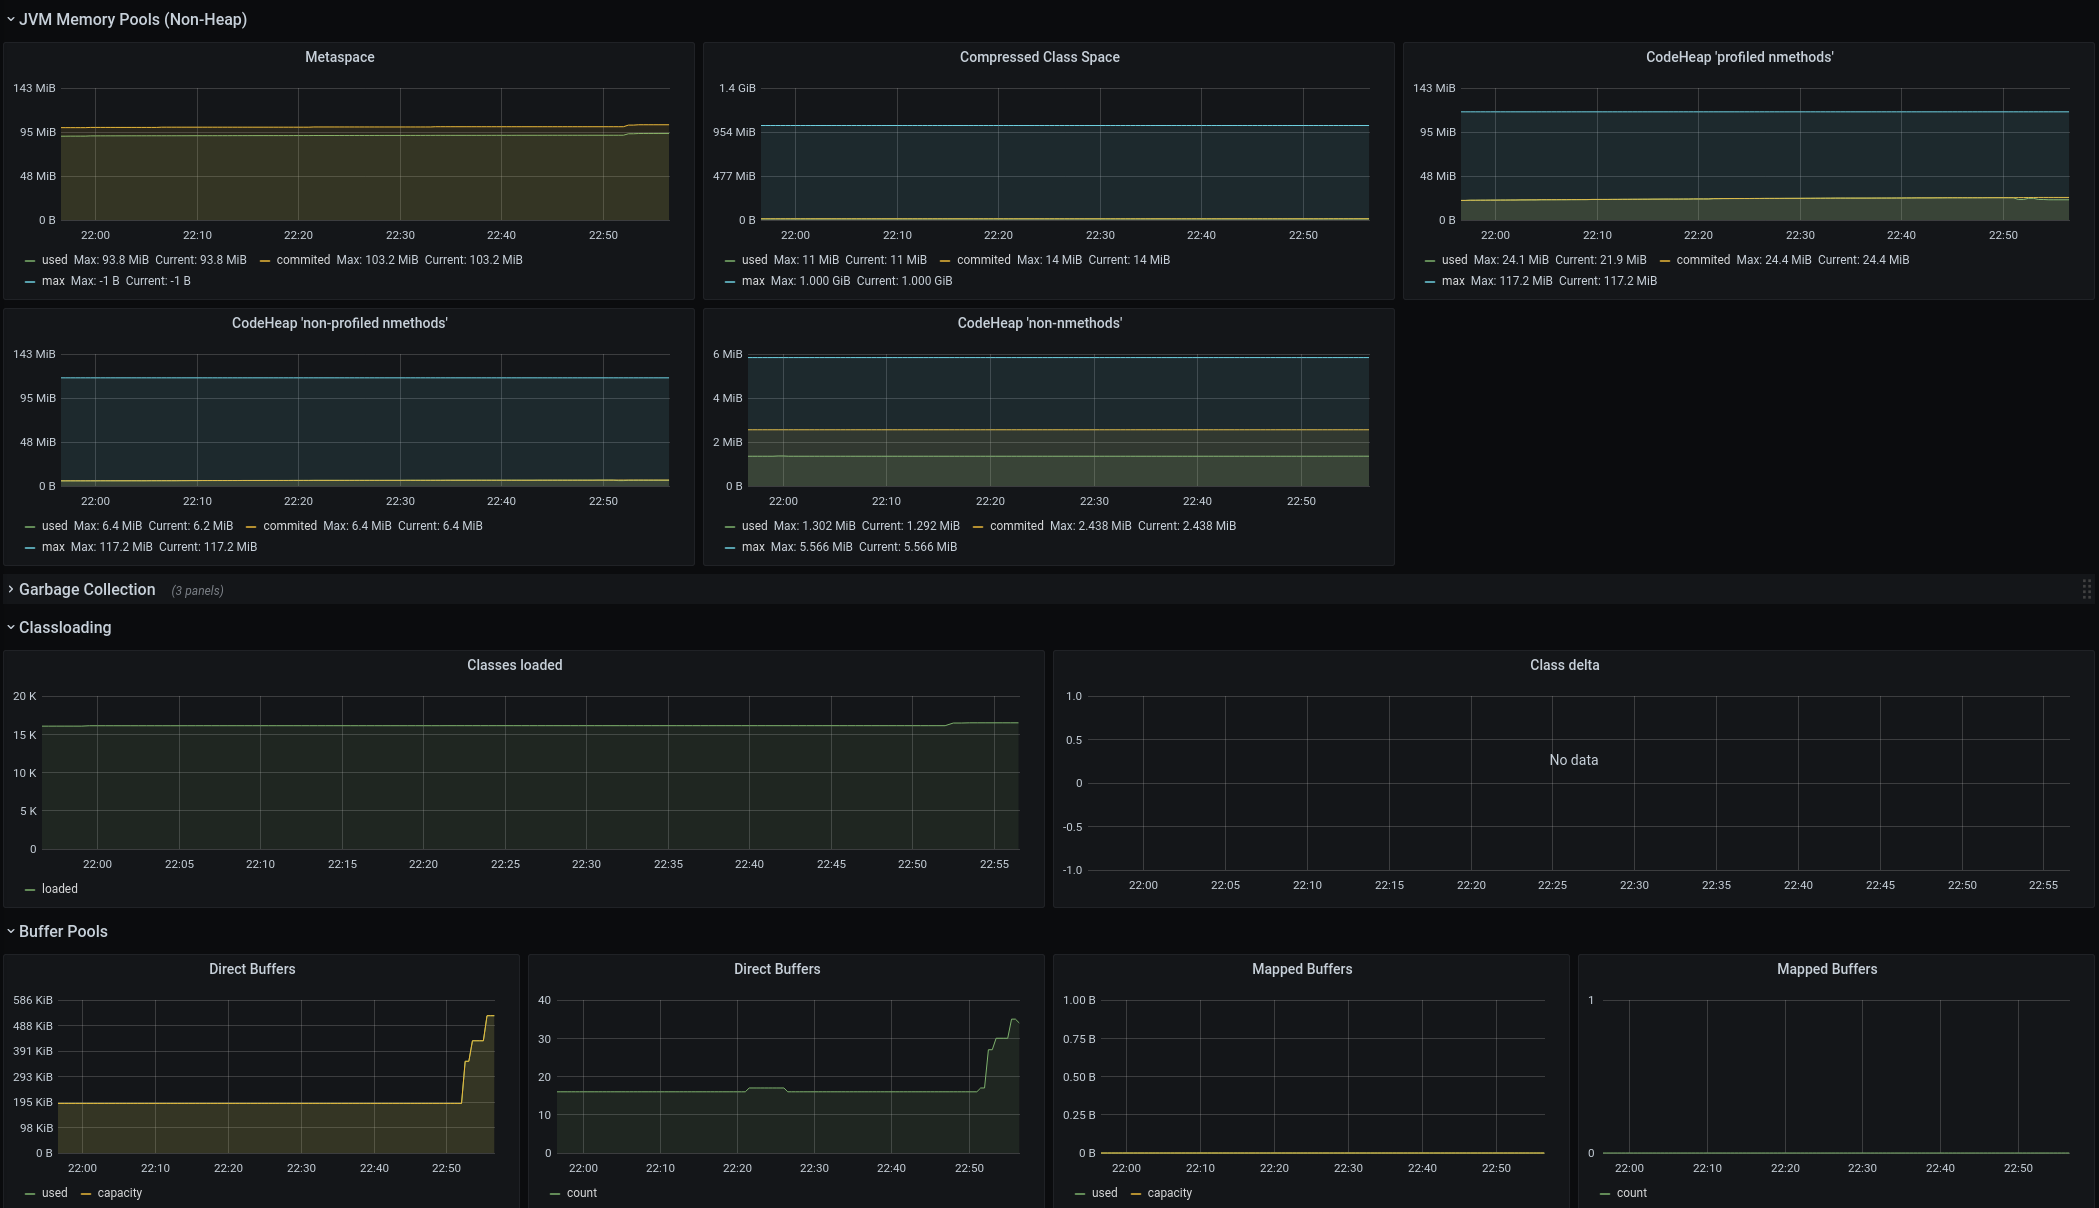
# Grafana
You can now visualize the results in Grafana. Micrometer provides a public Grafana dashboard here (opens new window). It has been adapted a little to include the openHAB metrics. You can download it here: Dashboard. This has been tested with Prometheus - for other monitoring systems, adaptations to the dashboard might be necessary.
Here are some screenshots: